#Modify this template and then save as html to create the .html template
import IPython
#this snippet insert a link to toggle the code visibility
from IPython.display import HTML
from IPython.display import Markdown as md
from IPython.display import SVG
host_dir = 'https://raw.githubusercontent.com/wasade/ddw-content/master' #replace this with the path to the individual_reports folder lives
participant_id = '10317.000091075'
biom_dropbox_link = 'https://www.dropbox.com/s/cgppjp4x5t483rc/10317.000091075_species_kraken_perc_individual.qzv?dl=0' #replace this is with the link to the kraken biom summary qzv
unifrac_dropbox_link = 'https://www.dropbox.com/s/cyg7gzkaiu1qkvo/10317.000091075_unweighted_unifrac_emperor_plot.qzv?dl=0' #replace this is with the link to the UniFrac Emperor qzv on dropbox
display(HTML("<style>.container { width:80% !important; align-items: center !important; justify-content: center;}</style>"))
display(HTML("""
<script>
    var code_show=true; //true -> hide code at first

    function code_toggle() {
        $('div.prompt').hide(); // always hide prompt

        if (code_show){
            $('div.input').hide();
        } else {
            $('div.input').show();
        }
        code_show = !code_show
    }
    $( document ).ready(code_toggle);
</script>
<a href="javascript:code_toggle()" style="color:white"></a>
"""))
display(HTML("""
<style>
    SVG.output {width: 100%; align-items: center;justify-content: center;}
    </style>
"""))
replace_dict = {':':'%3A','/':'%2F','?':'%3F','=':'%3D1'}
for symbol in replace_dict:
    biom_dropbox_link = biom_dropbox_link.replace(symbol,replace_dict[symbol])
    unifrac_dropbox_link =  unifrac_dropbox_link.replace(symbol,replace_dict[symbol])

biom_qzv_link = 'https://view.qiime2.org/visualization/?src=' + biom_dropbox_link
unifrac_qzv_link = 'https://view.qiime2.org/visualization/?src=' + unifrac_dropbox_link


Your Beyond Bacteria Report
Thank you for your participation in the American Gut Project though the Beyond Bacteria Perk! We appreciate your patience while we transitioned the sample processing for this perk from our collaborators to our in-house team at UC San Diego.
DISCLAIMER: The following report is intended FOR RESEARCH USE ONLY and is not a diagnostic test of any kind. It should *NOT* be used to inform any clinical, medical, or otherwise health- or lifestyle-related decision-making, behavior, or activity. As scientists we do our best to vet our data, ensure data integrity and provide the latest and best tools and analyses available, but we do not provide any medical or clinical information or advice and no information on specific organisms found in the sample you provided is intended to be used for this purpose.
Background Methods and Processing Information
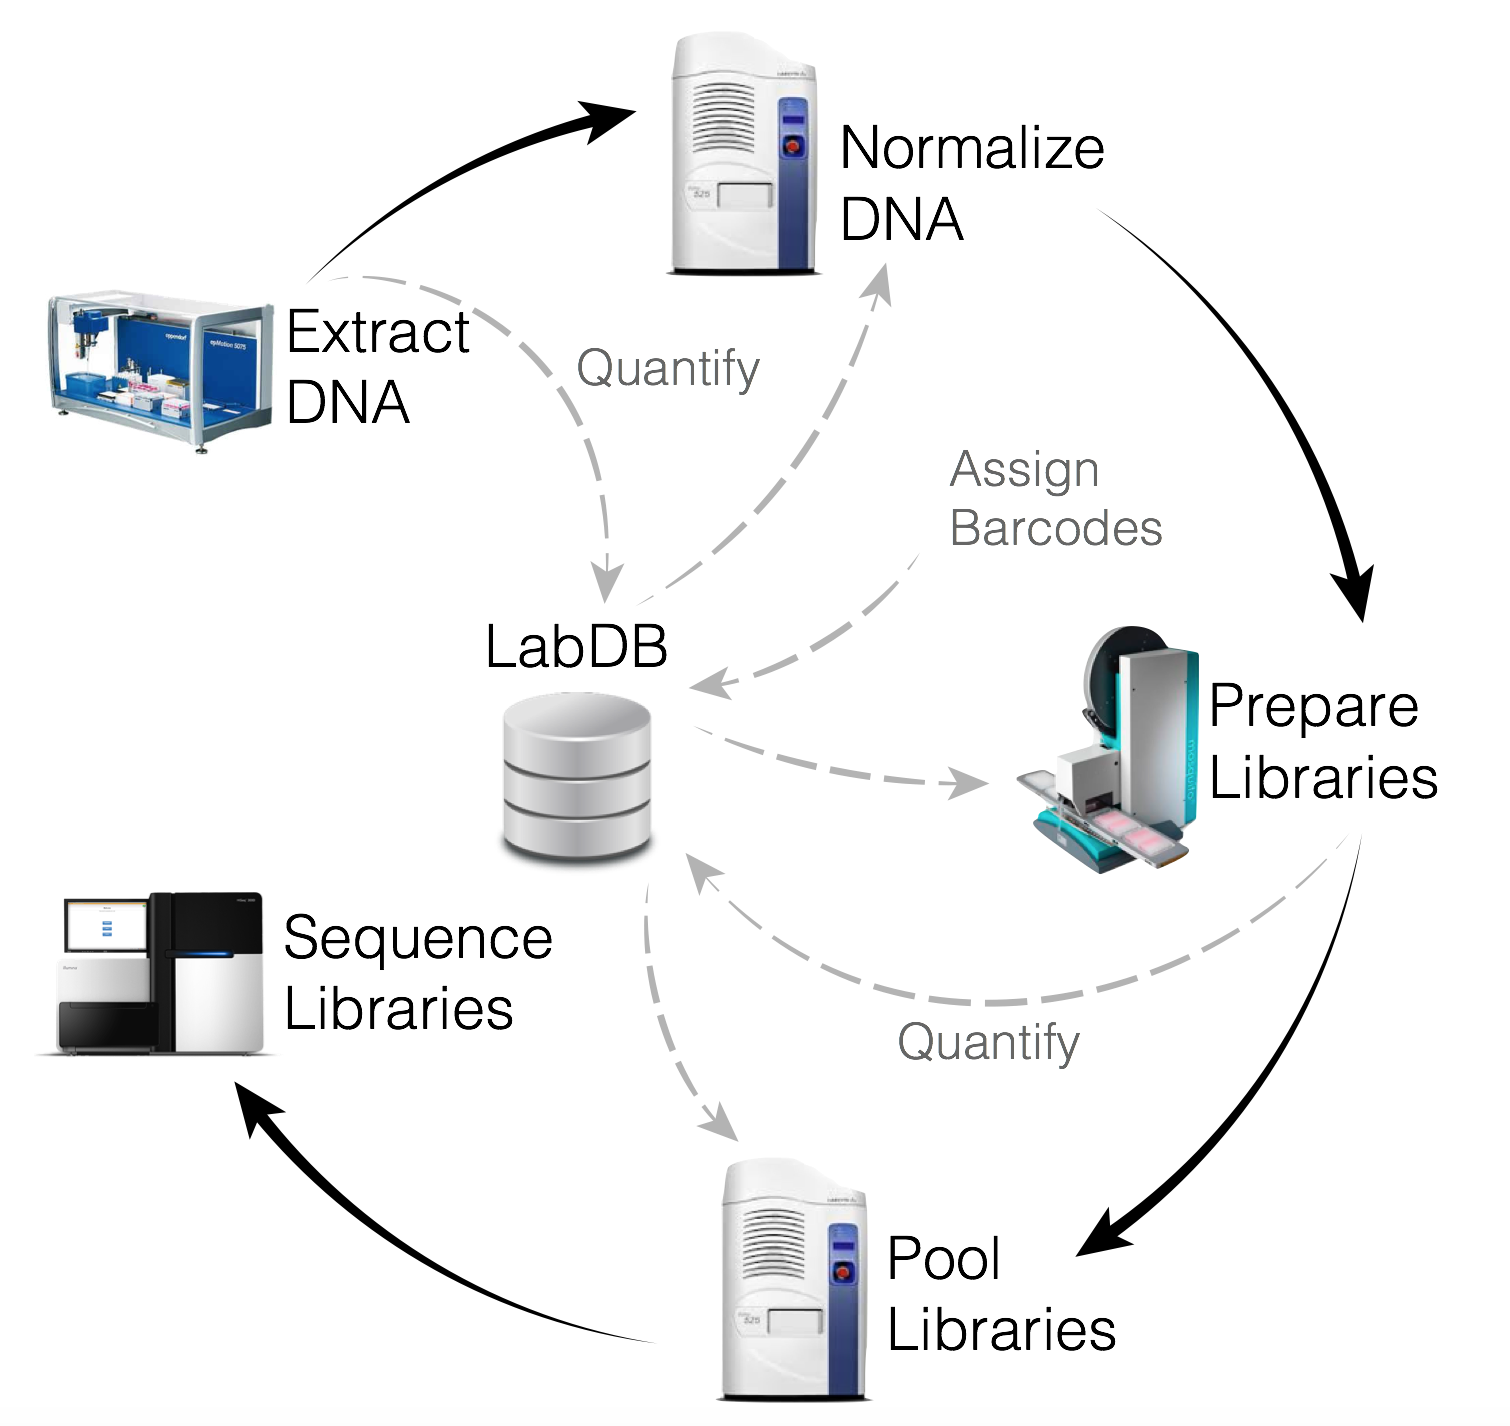
In the Knight Lab, part of the Center for Microbiome Innovation at UC San Diego, we extracted DNA from your sample using the Earth Microbiome Project (EMP) standardized protocol that was recently published in the November 2017 edition of Nature, and is available on the EMP website for easy reference. The extracted metgenomic DNA was then prepared for sequencing using our state-of-the-art shotgun library preparation and sequenced on a HiSeq4000.

Following sequencing, your samples were processed using the Oecophylla a sequencing analysis pipeline under development in the Knight Lab, via our supercomputing cluster 'Barnacle', which is housed in the San Diego Supercomputer Center at UC San Diego and managed by Knight Lab systems administrators. The Barnacle cluster includes 1024 Intel Ivy-bridge compute cores as well as 384 AMD compute cores, 12TB of total Ram with a 10GbE compute network. Storage includes 250TB of primary storage with equal amounts of dedicated backup for the different file systems. Unlike the amplicon sequencing data we use for the standard kit processing for the AGP which only detects bacteria whose 16S rRNA gene matches the patterns we commonly look for, deeper shotgun metagenomic sequencing detects all genomic DNA in the sample regardless of the type of organism present. This means that we can pick up microbes other than bacteria. It also means we have a lot more data to sort through. Using our tremendous supercomputing power, we can go beyond the operational taxonomic units (OTUs) reported for our standard kit assessment to determine species and sometimes even strain-level identity for the microbes in your sample.
If you would like to access your raw (.fastq) or processed (.biom) data, please contact us at info@americangut.org and we can provide you with instructions for accessing these large files. These data have had sequences removed that did not pass our quality control parameters, including those that matched to the human genome or our sequencing controls.
In the Oecophylla pipeline, the sequencing reads are matched to phyla, genera, and species using the Kraken database and functional pathways are identified using HUMANN2.
Results
The vast majority of the organisms detected in your sample were bacterial. Indeed >99% of the organisms detected in your sample were bacterial with <1% of sequencing reads orginating with the other three domains: Archae, Viruses, and Eukaryota, which in this case are exclusively measured as fungi.
kingdom_url = host_dir +'/individual_reports/'+participant_id + '/static_plots/' + participant_id + '_Kingdom.svg?sanitize=true'
display(SVG(kingdom_url))
Bacteria
Within the bacterial community, the organisms in your sample belonged primarily to a small number of phyla and genera, with some additional diversity seen at the species level. At baseline, each individual's microbiome consists primarily of the organisms best adapted to our diet, lifestyle, drug history and health conditions so samples tend to be dominated by just a small number of different types of bacteria.
bacteria_phylum_url = host_dir + '/individual_reports/'+participant_id + '/static_plots/' + participant_id + '_Bacteria_Phylum.svg?sanitize=true'
bacteria_genus_url = host_dir + '/individual_reports/'+participant_id + '/static_plots/' + participant_id + '_Bacteria_Genus.svg?sanitize=true'
bacteria_species_url = host_dir + '/individual_reports/'+participant_id + '/static_plots/' + participant_id + '_Bacteria_Species.svg?sanitize=true'

display(SVG(bacteria_phylum_url))
display(SVG(bacteria_genus_url))
display(SVG(bacteria_species_url))
Beyond Bacteria
Since our metagenomic sequencing pipeline is able to capture organisms beyond bacteria we have highlighted the most commonly detected archaea, viruses and fungi, though overall these were in much lower abundance.

Archaea
Archaea are microorganisms of similar size and shape to bacteria, however they are molecularly and genetically distinct from bacteria and are as related to bacteria as we are. Most of the Archaea detected in your sample was unknown, though this is to be expected since these organisms are not yet well characterized:
archaea_phylum_url = host_dir + '/individual_reports/'+participant_id + '/static_plots/' + participant_id + '_Archaea_Phylum.svg?sanitize=true'
archaea_genus_url = host_dir + '/individual_reports/'+participant_id + '/static_plots/' + participant_id + '_Archaea_Genus.svg?sanitize=true'
archaea_species_url = host_dir + '/individual_reports/'+participant_id + '/static_plots/' + participant_id + '_Archaea_Species.svg?sanitize=true'

display(SVG(archaea_phylum_url))
display(SVG(archaea_genus_url))
display(SVG(archaea_species_url))
Viruses
Similarly, when compared to the bacteriome, relatively little is known about the rapidly evolving viruses that dwell on the boundary between life and abiotic existence. This is reflected in the large number of unassigned, putative viruses detected from their DNA:
#virus_family_url = host_dir + '/individual_reports/'+participant_id + '/static_plots/' + participant_id + '_Virus_Family.svg?sanitize=true'
virus_genus_url = host_dir + '/individual_reports/'+participant_id + '/static_plots/' + participant_id + '_Viruses_Genus.svg?sanitize=true'
virus_species_url = host_dir + '/individual_reports/'+participant_id + '/static_plots/' + participant_id + '_Viruses_Species.svg?sanitize=true'

#display(SVG(virus_family_url))
display(SVG(virus_genus_url))
display(SVG(virus_species_url))
Fungi
The fungal microbiome has been studied in detail primarily through model organisms, and the food we consume such as beer, wine and cheese, which often contain fungi (or in the case of mushrooms and truffles, are entirely fungal). We found a small amount of fungi in your stool sample and the top organisms are below:
fungi_phylum_url = host_dir + '/individual_reports/'+participant_id + '/static_plots/' + participant_id + '_Fungi_Phylum.svg?sanitize=true'
fungi_genus_url = host_dir + '/individual_reports/'+participant_id + '/static_plots/' + participant_id + '_Fungi_Genus.svg?sanitize=true'
fungi_species_url = host_dir + '/individual_reports/'+participant_id + '/static_plots/' + participant_id + '_Fungi_Species.svg?sanitize=true'

display(SVG(fungi_phylum_url))
display(SVG(fungi_genus_url))
display(SVG(fungi_species_url))
md("You can explore all the organisms detected in your sample in the Qiime2 View below, by clicking on 'Feature Detail'. In this case each 'Feature' corresponds to a type of organism found in your sample. *Note: You can open this image in a new window [here](%s$).*"%(biom_qzv_link))
biom_summary_iframe = '<iframe src=' + biom_qzv_link + ' width=100% height=800></iframe>'
IPython.display.HTML(biom_summary_iframe)
md("The raw table of these values, viewable in Excel is [here](%s). For advanced users, you can access the [Qiime2 Artifact(.qza)](%s) or [BIOM(.biom)](%s) files."%(host_dir + '/individual_reports/'+participant_id + '/raw/tsv/' + participant_id +'_species_kraken_perc_individual.tsv',host_dir + '/individual_reports/'+participant_id + '/raw/qza/species_kraken_perc/' + participant_id + '_species_kraken_perc_individual.qza',host_dir + '/individual_reports/'+participant_id + '/raw/biom/species_kraken_perc/'+ participant_id +'_species_kraken_perc_individual.biom'))
Functional pathways
Determining which pathways and processes are active in a sample is best determined using alternative methods, but looking at the gene pathways detected in the samples can provide us insight into the functional potential of the microbial community. Life is complex—from the smallest organism to the largest—and the microbes that live inside us have adapted to the unique environment of the human body. To do so, they rely on a large variety of functional pathways to keep growing, multiplying, helping, and sometimes harming us.
The top 10 pathways detected in the provided stool sample are below, though these only make up a tiny portion of all the pathways detected in your sample.
function_url = host_dir + '/individual_reports/'+participant_id + '/static_plots/' + participant_id + '_function.svg?sanitize=true'

display(SVG(function_url))
md("The raw table of these values, viewable in Excel is [here](%s). For advanced users, you can access the [Qiime2 Artifact(.qza)](%s) or [BIOM(.biom)](%s) files."%(host_dir + '/individual_reports/'+participant_id + '/raw/tsv/'+ participant_id + '_humann2_cpm_individual.tsv',host_dir + '/individual_reports/'+participant_id + '/raw/qza/humann2_cpm/' + participant_id + '_humann2_cpm_individual.qza',host_dir + '/individual_reports/'+participant_id + '/raw/biom/humann2_cpm/'+ participant_id +'_humann2_cpm_individual.biom'))
Your Sample in Context
Your sample was combined for analysis with a subset of AGP samples that were processed for deeper shotgun metagenomic sequencing.
To visualize your sample in the context of these individuals, we have compressed all of the information about the composition of your sample into a single point and measured its similarity to the other individuals in a Principal Coordinates Analysis (PCoA) plot, just like the figures that you have likely seen Rob Knight present in his TED talk.
In the plots below, your sample is represented by the enlarged diamond-shaped point. You can compare where your sample sits relative to a variety of other information by clicking on the 'Color' tab from the menu on the right side of the plot and changing the category from 'country' to any of the other survey categories.
md("*Note: you may have to mouse over the image and zoom out depending on your monitor and browser size and settings. You can open this image in a new window [here](%s$).*"%(unifrac_qzv_link))
unifrac_iframe = '<iframe src=' + unifrac_qzv_link + ' width=100% height=1000></iframe>'
IPython.display.HTML(unifrac_iframe)
Conclusions
No matter what you find in your gut, remember that these methods and techniques are on the cutting edge of research and will require years of validation and confirmation before we'll know how to interpret them to guide diets, lifestyles and healthcare decisions. While there are some emerging clinical trials that implement microbiome information, we would like to stress again that no clinical, medical, or otherwise health- or lifestyle-related decision-making, behavior, or activity is advised based on this data. Instead, as with any health matter that arises, if you find something of concern, we recommend you remember that this report is research-grade only and instead contact your local primary care provider to discuss your specific health conditions and options.
Thank you again for your participation in the American Gut Project and we look forward to your feedback and continued support for this citizen-science led initiative.
